
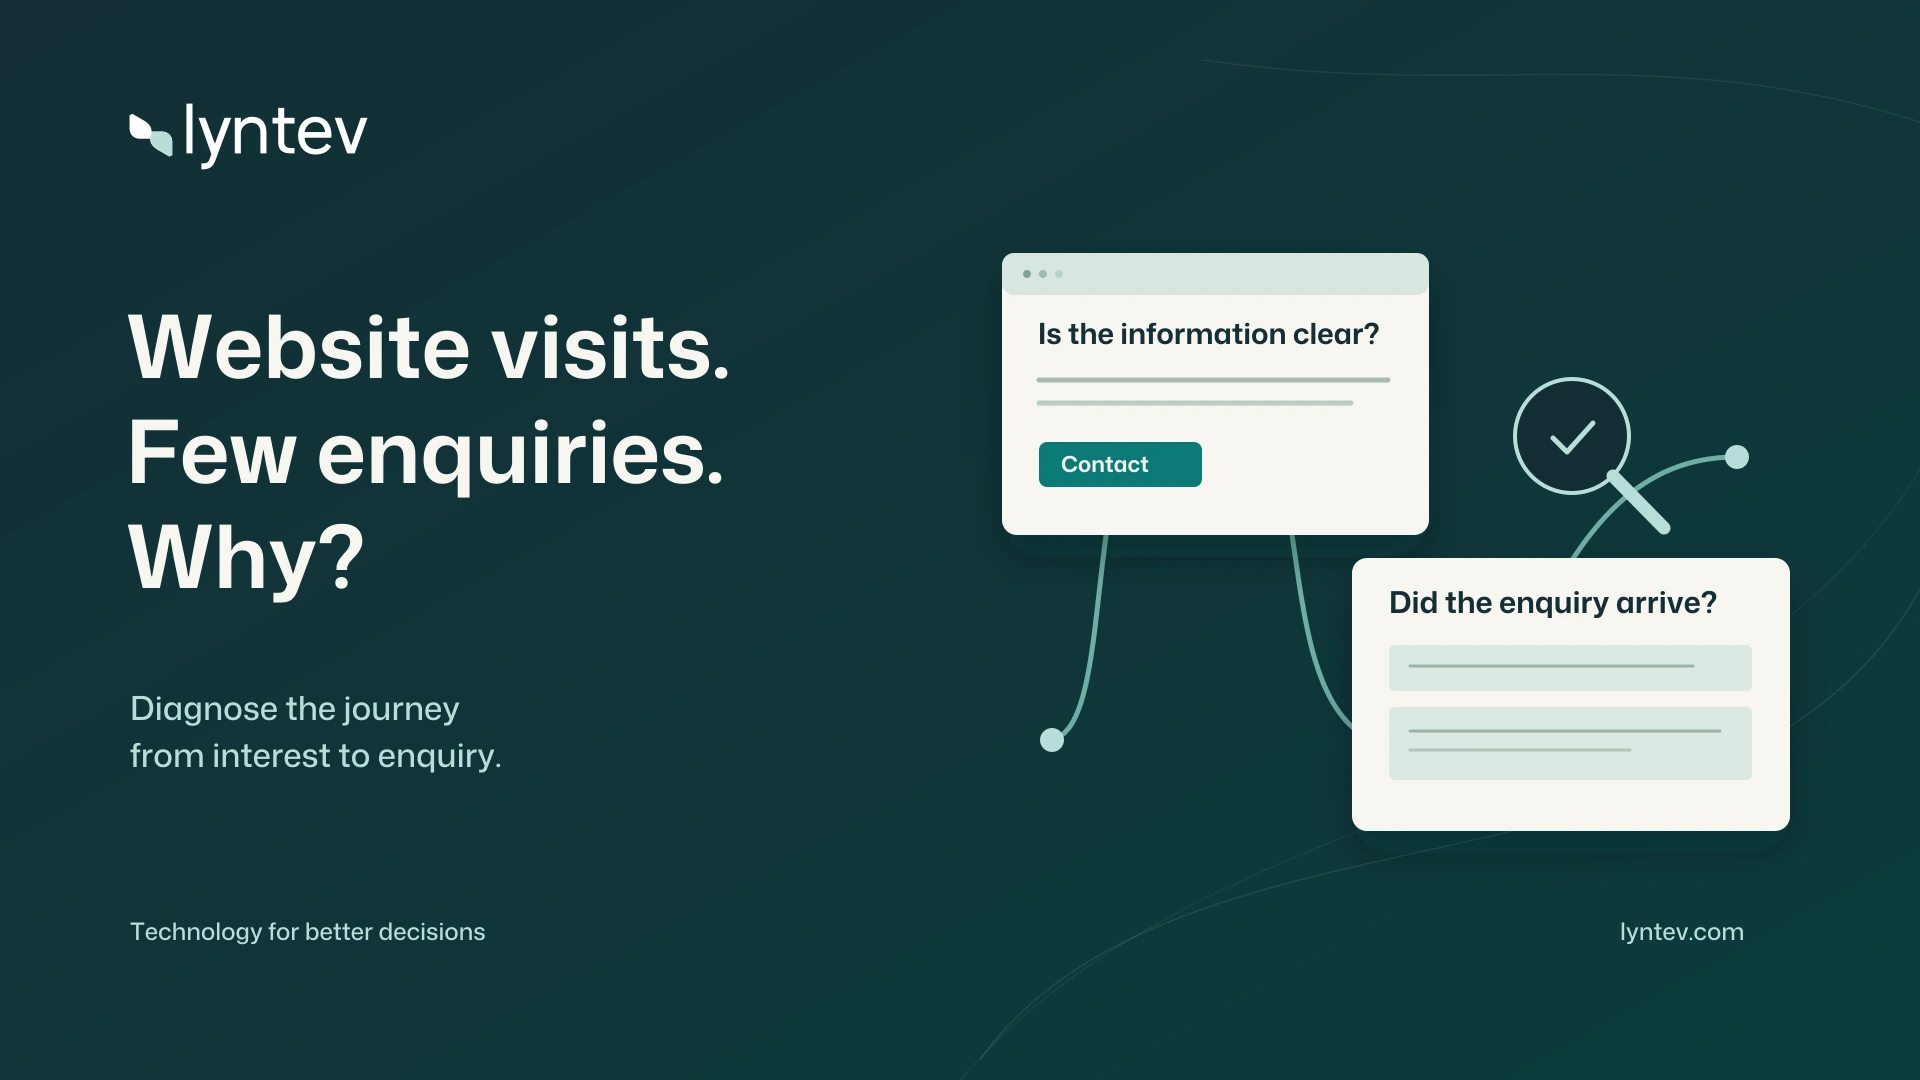
Your website gets visits. Why aren't you receiving enquiries?
A diagnostic method covering demand, clarity of the offer, user experience and measurement
In this article:
- Distinguish clicks, received requests and sales.
- Find the first obstacle in the customer journey.
- Assess results using appropriate denominators and volume.
Abstract
An increase in website visits can coexist with few enquiries for different reasons: an unsuitable audience, insufficient information, interface friction, failures in receiving requests or incomplete measurement. This article presents a narrative review of literature on the customer journey and experimentation, combined with technical documentation on performance, search, forms and consent. It proposes a staged diagnosis, a minimum dictionary of metrics and an improvement plan proportionate to traffic volume. Clicks, requests received, qualified contacts and sales are distinguished, avoiding the use of interface indicators as evidence of business results. A numerical example demonstrates how differences between rates can be consistent with random variation in small samples. The analysis concludes that optimisation should begin with the integrity of the journey and the usefulness of the information, keeping hypotheses testable and success criteria defined before changes are made. The method prioritises task observation and evidence-based corrections when traffic volume cannot support informative quantitative experiments.
Keywords: conversion; websites; user experience; forms; experimentation; digital measurement.
1. Introduction
A business may observe hundreds of visits and receive few requests. That result alone does not identify the cause. Visitors may be looking for a job, reading an article or comparing a service the business does not provide. They may also find the right service and give up because they do not understand the price, cannot use the form or receive no response.
Conversion should be defined as an action that has meaning for the business. Opening WhatsApp, sending a request and purchasing a service are distinct events. Improving the first may not improve the others. Diagnosis needs to follow the journey to the point where the business can confirm what actually happened.
This article organises that diagnosis into six questions: are visitors looking for the right service; is the proposal understandable; is there information to make a decision; does the journey work; does the team receive and follow up on requests; and do the data allow the change to be assessed? The sequence helps avoid successive visual changes unrelated to an observed problem.
2. Method and nature of the proposals
The narrative review was carried out with sources consulted on 20 November 2026. Works on customer experience and experimentation, original documentation from Google and W3C, and EDPB guidelines were selected. Search terms included “customer journey”, “online controlled experiments”, “Core Web Vitals thresholds” and “form user notification”.
No business’s traffic data was audited and no A/B tests were carried out for this article. The statistical example is fictional, and the diagnostic plan is an applied proposal developed for this purpose. The review does not seek to estimate a universal conversion rate, because the audience, offer, price, source of the visit and definition of the indicator change the meaning of the comparison.
3. Are visitors looking for the services you offer?
The customer journey may span several channels and moments. The synthesis by Lemon and Verhoef is useful for understanding that a visit may represent discovery, evaluation or a decision, and that not all touchpoints are under the business’s control. The analytical consequence is to interpret the purpose of each page and each traffic source, rather than expecting the same enquiry rate from every visit. (Lemon & Verhoef, 2016)
A contact page and an informative guide serve different tasks. The guide may be useful to someone still far from purchasing. The commercial page should allow the visitor to assess suitability and proceed. It is also important to check geographical relevance, language, the service sought and whether the request fits the business’s scope.
Search queries available in Search Console can show how pages appear in searches, but the data is aggregated and has limitations. It should be used to formulate hypotheses: for example, a page may attract demand for a feature it does not provide. The next step is to review the content and journey, without assuming that every impression represents an intention to purchase.
Google recommends helpful content, descriptive titles and understandable links. Wording should match the audience’s needs and the actual content. Adding terms for needs the page does not address can attract unsuitable visits and weaken the experience. (Google, s.d.-a)
4. Can the person understand the offer and make a decision?
4.1. Initial clarity
In the first moments, visitors should be able to recognise the service, who it is suitable for and what they can do next. This understanding can be observed by asking someone who matches the audience’s profile to explain, in their own words, what the business offers. If the answer depends on guessing the meaning of a slogan, there is an information problem to investigate.
Consider a fictional maintenance provider. “Solutions for your comfort” can be interpreted in several ways. “Air conditioning installation and maintenance in Leiria” describes an activity and an area. The following text can clarify service types, terms and how to ask about availability. This example illustrates clarity without demonstrating, on its own, which wording converts better.
4.2. Decision information and trust
Review the questions that arise before a purchase: scope, exclusions, price or calculation, conditional timeframe, required materials, support and ending the service. When the price depends on an assessment, explaining what determines it is more useful than leaving the person without any basis for judging it. Real cases should be distinguished from demos, and figures, testimonials or guarantees without evidence should be avoided.
A button does not resolve an incomplete proposal. The action should match the intention: requesting a quote, checking availability and purchasing are different commitments. What happens next should also be stated. “Send request” is appropriate when the team still needs to assess it; “appointment confirmed” is only correct when confirmation has actually taken place.
5. Does the journey work on real devices?
5.1. Forms and contact
W3C recommends identifying controls through associated labels and describing their purpose. Placeholder text inside a field does not necessarily replace a persistent label. In the assessment, check the field name, instructions, mobile keyboard, focus order and a clear indication of what is required. (W3C, s.d.-a)
Submission confirmation and error messages should also be observable. W3C’s tutorial on notifications advises explaining the outcome, identifying problems and indicating how to correct them. Testing should include a deliberate error and a successful submission, checking whether the person understands the difference and can continue without losing their work. (W3C, s.d.-b)
Test the journey through to its destination: did the email arrive; was the request recorded; is the WhatsApp number correct; can the call be initiated; does the team know who is following up? Testing should use demo contact details and clear test data where appropriate. Success displayed on the page does not prove that the request reached the person responsible.
5.2. Accessibility and stability
WCAG 2.2 includes criteria relevant to keyboard use, visible focus, contrast, control identification and the prevention of obstacles. A conversion assessment should consider these conditions because they form part of the ability to complete the task. Full conformity should not be claimed solely on the basis of an automated test or a limited set of checks. (W3C, 2024)
Motion, fixed menus and notices should be observed during use. If a button changes position as someone tries to tap it, or a bar covers the field being filled in, the problem is operational. It is possible to maintain a carefully designed visual presentation without moving essential actions, hiding information until an animation ends or obstructing people who prefer reduced motion.
5.3. Performance
Core Web Vitals use an LCP of up to 2.5 seconds, an INP of up to 200 milliseconds and a CLS of up to 0.1 as references for good performance, assessed at the 75th percentile of visits. The indicators measure loading, response to interaction and visual stability. A laboratory measurement helps diagnosis, but does not equate to the performance experienced by every visitor; a single Lighthouse score does not demonstrate satisfactory real-world INP. (Google, s.d.-c)
When there is insufficient field data, record the test conditions: device, network, version and tool. Investigate the largest visual element, images, fonts, code that blocks interaction and layout changes. The correction should be checked on the same task and under comparable conditions. Technical performance is one part of the experience, not a predicted conversion rate.
6. Measuring without confusing events and results
A minimum dictionary is proposed to track operations without collecting field content. Service or page identifiers may be sufficient; names, messages, health information, sensitive parameters and full addresses should not be sent unnecessarily to analytics tools.
| Metric | Definition | What it does not demonstrate |
|---|---|---|
| Contact click | Clicks on the action / observed eligible sessions | That a message or call was completed |
| Request received | Confirmed valid requests / observed eligible sessions | That there is a suitable fit or a sale |
| Qualification | Suitable contacts / contacts assessed | That the proposal will be accepted |
| Acceptance | Accepted proposals / proposals with a recorded decision | The full contribution of earlier channels |
| Response time | Interval until a useful response, under a defined rule | The final quality of the resolution |
Table 1 note. Author’s own work. The unit, time window and exclusion rules should remain consistent. Comparisons between tools require checking each one’s definitions.
The measured population may exclude people who declined optional statistics, use blockers or switch devices. The EDPB’s consent guidelines require attention to freedom, information, specificity and withdrawal. In the analysis, metrics collected with consent should be described as an observed subset; missing data should not be addressed through collection that is incompatible with the visitor’s choice. (CEPD, 2020b)
It is useful to supplement digital indicators with brief questions, such as “how did you find us?”, and minimal operational records. Responses are subject to recall bias and should not be treated as perfect attribution. The aim is to gather converging evidence to guide the next improvement.
7. When does an A/B test make sense?
Well-designed randomised experiments make it possible to estimate the causal effects of changes. Applied research by Kohavi and colleagues shows the value of testing ideas rather than relying solely on the team’s predictions. A hypothesis, randomisation unit, primary metric, analysis conditions and duration need to be defined before results are observed. (Kohavi et al., 2009)
A fictional example helps interpret small differences. One version receives eight enquiries in 200 eligible sessions, or 4%. Another receives twelve in 200, or 6%. The difference is two percentage points, corresponding to an observed relative increase of 50%. However, “50% better” is insufficient to establish an effect: there are only four additional enquiries and there is sampling uncertainty.
Using a simple normal approximation for two independent proportions, the 95% interval for the difference is approximately -2.3 to +6.3 percentage points. The example shows that the data is consistent with no improvement. The approximation is educational and, with small samples, should be replaced or confirmed by an appropriate method; repeated sessions by the same person may also violate the independence assumption.
Checking whether the observed distribution of participants matches the planned allocation is another important precaution. Microsoft describes sample ratio mismatch as a sign that assignment, recording or selection errors may make results unreliable. Analysis of effects should begin with data quality. (Microsoft Research, 2020)
For low traffic, the recommendation is to begin with task observation and correcting clear failures. Asking a few people with characteristics of the audience to find information and send a request may reveal obstacles. This exploratory test does not estimate the prevalence of problems or demonstrate an increase in sales; it helps identify what should be corrected or investigated.
8. Diagnostic and improvement plan
| Stage | Work | Verifiable deliverable |
|---|---|---|
| 1. Integrity | Test actions, receipt, consent and errors | List of failures with evidence and corrections |
| 2. Information | Review the service, price, terms and next action | Page able to answer priority questions |
| 3. Use | Observe tasks on mobile and using a keyboard | Obstacles described and checked again |
| 4. Measurement | Check definitions and compare periods | Indicators with context and limitations |
| 5. Experiment | Test a specific hypothesis when there is sufficient volume | Prior plan and analysis consistent with the data |
Table 2 note. Author’s own work. Duration depends on volume and complexity; there is no need to wait for a statistical test to correct a wrong destination or a broken form.
Prioritisation should consider impact on the journey, available evidence, effort and regression risk. Changes to menus, forms and main content need to be checked again. It is advisable to keep the previous version and record what changed. If several conditions change at once, the overall result can be assessed, but attributing it to a particular element becomes harder.
9. Discussion and conclusion
Visits without enquiries call for diagnosis, rather than a single explanation. Unsuitable demand, commercial questions, usability problems, operational response and measurement failures can coexist. Each cause requires a different check. A visually well-designed page should also allow people to understand, decide and complete the action reliably.
The proposed method does not establish an ideal rate for every sector. The scientific basis supports journey analysis and experimentation, while standards and technical documents guide implementation. The frameworks are the author’s own proposals and the figures are illustrative. Progress should be assessed through useful requests, a consistent experience and results actually confirmed by the business.
Appendix A. Task observation script
- Fictional context: “You need this service and reached this page through a search”.
- Ask the person to explain what the business offers and who it is intended for.
- Ask them to find the price or terms, timeframe and contact method.
- Ask them to send a test request; observe without giving away the solution.
- Check understanding of the confirmation and receipt by the person responsible.
- Record obstacles, device and version; correct them and repeat the relevant task.
Three ways to apply this analysis.
Investigate how visitors arrive through search and the words customers use. If you have a shop, also check the basket journey.
How to read clicks, impressions and CTR in Search Console
Turn the search report into a content decision you can track.
How to choose keywords for your business
Move from customers’ language to a shortlist of pages with a purpose.
Abandoned baskets: find the cause before sending reminders
Repair the purchase journey and define permitted contact before enabling automation.
Editorial disclosure
Institutional authorship and editing: Lyntev. A narrative review and applied analysis, prepared with artificial intelligence support and not submitted for peer review. Frameworks and scenarios identified as our own do not constitute empirical research results.
Lyntev provides website and software services and has a commercial interest in these topics. The cited sources do not assess or recommend Lyntev or its products. The articles provide general assessment criteria; technical, legal or clinical decisions require consideration of the applicable context.
Sources consulted when preparing the edition of 20 November 2026. Have you found something that needs correcting? Contact Lyntev and identify the article and reference.
References
Comité Europeu para a Proteção de Dados [CEPD] (2020b). Guidelines 05/2020 on consent under Regulation 2016/679. 4 de maio de 2020.
Regulatory guidanceGoogle (s.d.-a). Search engine optimization (SEO) starter guide. Google Search Central.
Technical documentationGoogle (s.d.-c). How the Core Web Vitals metrics thresholds were defined. web.dev.
Technical documentation and metrics methodologyKohavi, R., Crook, T., Longbotham, R., Frasca, B., Henne, R., Lavista Ferres, J., & Melamed, T. (2009). Online experimentation at Microsoft. Microsoft Research.
Applied research on experimentationLemon, K. N., & Verhoef, P. C. (2016). Understanding customer experience throughout the customer journey. Journal of Marketing, 80(6), 69-96.
Scholarly article: conceptual synthesisMicrosoft Research (2020). Diagnosing sample ratio mismatch in A/B testing. Experimentation Platform, 14 de setembro de 2020.
Applied research and technical guidanceWorld Wide Web Consortium [W3C] (s.d.-a). Labeling controls. Web Accessibility Initiative. Forms Tutorial.
Technical guidanceWorld Wide Web Consortium [W3C] (s.d.-b). User notification. Web Accessibility Initiative. Forms Tutorial.
Technical guidanceWorld Wide Web Consortium [W3C] (2024). Web Content Accessibility Guidelines (WCAG) 2.2. W3C Recommendation, edição de 12 de dezembro de 2024.
Technical standard
From analysis to application.
Continue the series.
All research articles- Digital presenceI'm on Instagram. Do I also need a website?
- Artificial intelligenceAI in customer service: what studies show and how to evaluate it in your business
- Website investmentWhat is the real cost of a professional website?
- Salon managementHow to choose business management software for a beauty salon
- Clinic managementSoftware for clinics: what to test before signing a contract